Reading time: 6 minutes
Since the 1960s, cities and states across the country have produced about 1.1 new housing units for every household formed – young people moving out of family homes, couples forming new households, or in-migration. If the ratio is greater than one to one, it means there is enough housing supply to account for demolition, obsolescence, and second or vacation homes. In recent years, adding homes was mostly achieved through greenfield development and sprawl in ever-growing suburbs and exurbs.
Since 2000, however, this ratio fell to only 1.03 units per new household, primarily driven by the growth of and demand for housing in cities. In the aftermath of the Great Recession the ratio fell even farther, to only 0.93 units per new household. The Great Recession may have made our housing production crisis worse, but a rebounding economy didn’t solve it, either.

Housing underproduction is often the most acute in high opportunity neighborhoods – places with access to jobs, strong economies, transit, and amenities. Underproduction means that fewer people can live in these vibrant neighborhoods and livable communities. Further, when supply is outstripped by demand, rents rise, neighborhoods experience rapid change, and lower-income households become even more cost-burdened – or are forced to move from the places they call home.
Utah’s underproduction follows a pattern similar to the rest of the nation. From 2010 to 2019, 1.02 units were produced in Utah for every household that was formed—below the long run national average of 1.15 units per new household. In most of the highly populated counties, production was less than 1—Salt Lake County produced 0.95 units, Davis County produced 0.93, and Weber County produced 0.84 housing units for every new household formed. The Salt Lake City metro area experienced underproduction rates on par with some of the least affordable markets across the county. The result is fewer homes and much higher rents and home prices.
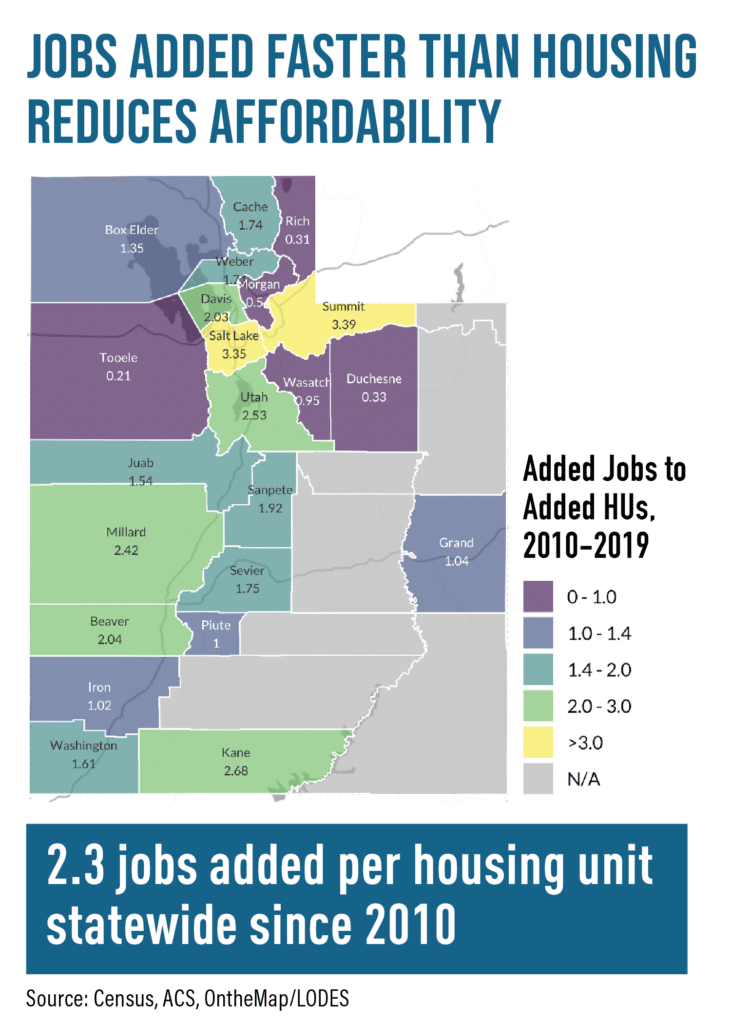
Beyond household formation, job growth is the other primary driver of housing needs. Since 2010, there were 2.3 jobs added for every new housing unit built statewide, with several counties adding more than 3 jobs per housing unit.
Another way to measure affordability is the American Enterprise Institute’s “Carpenter Index,” which looks at the share of starter homes that are affordable to middle-income workers. In 2012, 51% of starter homes in Salt Lake City were affordable to middle income workers. By 2018, the share dropped to 19%. This is one of the lowest levels of affordability among major American metropolitan areas.
These trends are unsustainable for a state that is committed to smart and equitable growth.

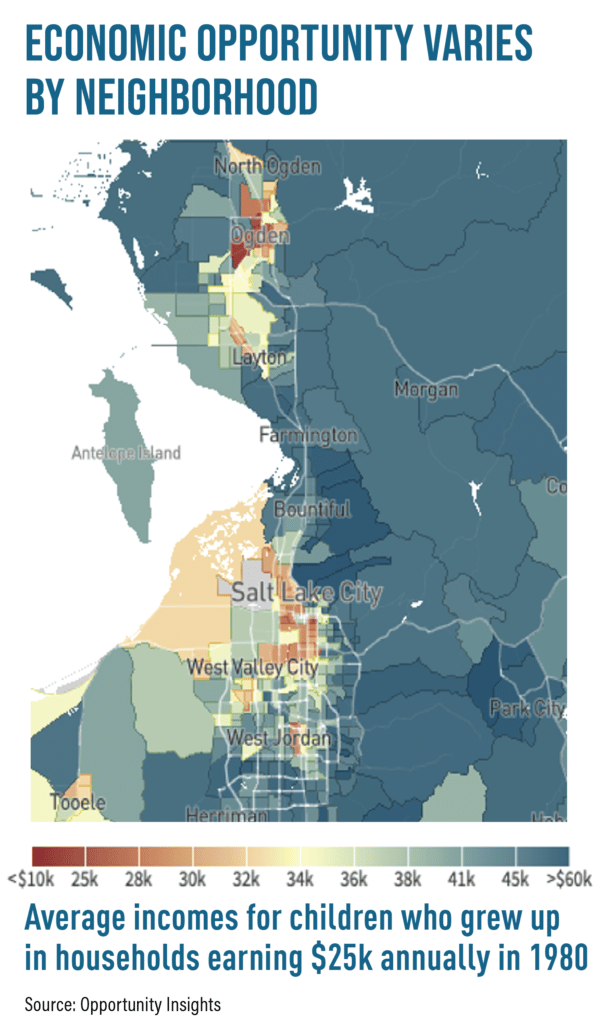
Fortunately, Utah ranks high in economic opportunity indicators, based on research from Opportunity Insights, based at Harvard University. A child growing up in a low-income household (where parents earn an annual income of about $25,000) in many areas of Utah is likely to earn more – in some instances double – what their parents earned. But when this metric is examined on a neighborhood basis, stark differences emerge.
When assessing the housing developed since 2010, the majority of housing is not being built in in areas high opportunity areas, such as those with easy access to transit. Almost 43% of housing units were built in areas with lower opportunity – below the statewide median economic opportunity. A significant contributing factor in this trend is housing policy, and in particular exclusionary zoning.
Utah has an opportunity to reverse these trends by leveraging invests in transit and coupling them with housing.
As the Salt Lake Valley’s light rail system, TRAX, was first being constructed in 2000, housing density near station areas was the same as the median block group in Salt Lake County. In other words, housing blocks located near light rail stops (within one-half mile) were not prioritized for denser housing development. But over the last 20 years, the areas near stations have added 300% more housing than the median block group in the County.
Despite these positive trends, there are still opportunities to build housing near underutilized transit stations. The median housing density for a block group in Salt Lake County was 3.5 units per acre (UPA) in 2020. About 43% of station areas have densities below 3.5 UPA. Ensuring that denser housing is built in these areas will have immense benefits for both present and future residents of the Greater Salt Lake.
The Salt Lake City metro area has an opportunity to increase access to jobs, boost its economy, and ensure its retail and commercial amenities thrive by enacting policies to break down barriers and spur more housing – especially in job- and transit-rich, high-opportunity neighborhoods. Leveraging public investments in infrastructure like transit and building more homes in high-opportunity neighborhoods is key to advancing equity in the region.
